q11·intermediate
How has the urban heat island in my city changed over decades?
landurbanclimatepublic-health Datasets: 6 20–60 min
▶ Find the data for your area
Draw a rectangle to pick your area of interest, then see what NASA data covers it (live, here in your browser) or download a ready-to-run notebook with your AOI pre-filled. The notebook runs in any Python environment — it needs a free Earthdata Login to fetch the data.
Current AOI:
80.15, 12.95 → 80.35, 13.2 (Chennai)How has the urban heat island in my city changed over decades?
What you can answer
- Multi-decade LST trend for urban core vs surrounding rural (MODIS Terra 2000+)
- Diurnal heat-island intensity (day vs night, MODIS Terra morning + Aqua afternoon)
- Hyper-local heat hotspots at 70 m (ECOSTRESS) — playgrounds, asphalt parking lots, factories
- Urbanization correlate — Black Marble nighttime lights expansion paralleling LST increase
- Heat impact on environmental-justice corridors — overlay LST with demographic data
What you can NOT answer with these alone
- Surface air temperature (LST is the skin temperature, can differ from 2-m air temperature by 5-15 K)
- Indoor heat exposure
- Heat-island mitigation effect of specific interventions without ground-truth measurement campaigns
Code template
import earthaccess
import xarray as xr
import numpy as np

earthaccess.login(strategy="netrc")

# Example: Chennai, India
city_aoi = (80.15, 12.95, 80.35, 13.20)
rural_aoi = (80.45, 12.95, 80.65, 13.20)  # ~25 km east as control
window = ("2000-03-01", "2025-12-31")

# 1. MODIS Terra daytime LST (10:30 AM overpass)
mod_lst = earthaccess.search_data(short_name="MOD11A1", bounding_box=city_aoi,
                                  temporal=window)
# Open + extract LST_Day_1km; spatial mean over city, rural
# Filter QC flag (use LST_Day_1km_QC; only QC=0 quality)

# 2. Compute urban-rural temperature difference per day → annual mean → trend
# 3. MODIS Aqua nighttime LST (1:30 AM overpass) — usually larger UHI
myd_lst = earthaccess.search_data(short_name="MYD11A1", bounding_box=city_aoi,
                                  temporal=window)

# 4. ECOSTRESS 70m for the modern era (2018+)
eco = earthaccess.search_data(short_name="ECO2LSTE", bounding_box=city_aoi,
                              temporal=("2018-08-01", "2025-12-31"))
# Map current spatial pattern at 70m

# 5. Plot:
#    - 25-year line: city minus rural LST anomaly
#    - Map: ECOSTRESS 70m LST overlaid on city map (highlight hot pockets)
#    - Trend bar: annual mean UHI intensity
Expected output
- Decadal trend line: urban-rural LST difference 2000-present (degrees K)
- High-resolution map: ECOSTRESS 70m LST for the current year showing within-city variability
- Comparison: day vs night UHI intensity
- Overlay: Black Marble nighttime lights growth on top of LST trend
Caveats
- LST is skin temperature, not air temperature — for human-heat-exposure work, model the conversion or combine with weather-station data
- Cloud screening eliminates many days — annual aggregates smooth this
- QC flag is critical; cloudy pixels get assigned bad values that look reasonable until averaged
- Pixel mis-registration at 1 km can blur urban-rural transitions; use ECOSTRESS for sharper boundaries
- ECOSTRESS has variable revisit + no pre-2018 record — use MODIS for the long trend
Cross-DAAC composition
LP DAAC for MODIS LST + ECOSTRESS — single DAAC; uniform Earthdata Login.
Sources
- MOD11A1 user guide: https://lpdaac.usgs.gov/products/mod11a1v061/
- ECOSTRESS science: https://ecostress.jpl.nasa.gov/
- Black Marble: https://blackmarble.gsfc.nasa.gov/
✦ Worked example — real result
Chennai's urban heat island, measured
MODIS Terra land-surface temperature (MOD11A1), April–May 2024 hot season
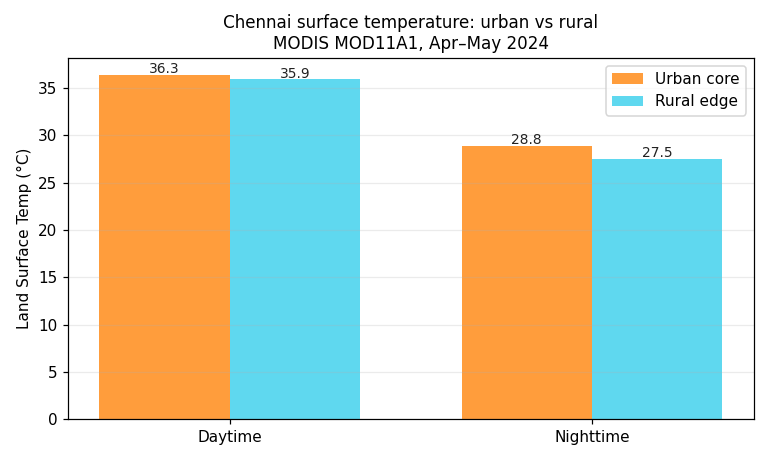
+1.3 °C
Nighttime surface heat-island (urban warmer)
+0.4 °C
Daytime heat-island (much weaker)
19–23
Cloud-free days averaged
What it means.The heat island is ~3× stronger at night (+1.3 °C) than by day (+0.4 °C) — the classic urban-heat-island signature: the city's concrete and asphalt soak up heat all day and release it slowly after dark, while rural land cools faster. A naive single-day daytime check can even show the city cooler than dry surrounding land (the "surface urban cool island"), which is why the honest answer needs night data and many days.
How this was computed (reproducible)
Searched MOD11A1 over a Greater-Chennai box for Apr–May 2024 (61 daily granules), downloaded 30, read
LST_Day_1km and LST_Night_1km from the HDF-EOS2 files, geolocated the sinusoidal grid, sampled 5×5-pixel means at an urban-core and a rural-edge point, masked fill values, and averaged across cloud-free days. Run live with earthaccess against NASA LP DAAC.Datasets used
MOD11A1
How hot the ground gets each day
MODIS Terra Land Surface Temperature/Emissivity Daily 1km
LP DAAC · 1 km
ECO2LSTE
Plant heat stress & water use
ECOSTRESS L2 Land Surface Temperature & Emissivity
LP DAAC · 70 m
MCD12Q1
What covers the land (forest, city, crops)
MODIS Combined Land Cover Yearly 500m
LP DAAC · 500 m
📚 Problem Finder KB
1 matching entry in the Knowledge Base:
§14 Glossary
MODIS LST MOD11A1 / MOD11A2
LP DAAC